the map is not the network - the network is the territory
We are in a phase where the idea of cyberspace as a “nowhere” has been dropped. Instead, right now, it is all geolocation, geolocation, geolocation.
At the same time, we are supposed to freely consume online as if there is no location. As if it all has no impact and no place. An ongoing 302 redirection and redistribution to datacenters and the cloud.
For this workshop, we proposed to look at relations and diagrams instead of maps and geoip. There is a technonormative push to ‘drop a pin’, and follow the geoip. But that won’t help us really understand where we are, or help us understand where in the diagram of the power relations we are1.
The word diagram in this workshop is used in two senses. One coming from the mathematical, statistical, engineering perspective, with the role to describe, enact a form of control, or provide a bird’s-eye view of a process…
Parallelly, it has been used in philosophy to mean a scheme of the power relations of some structural elements of society. Foucault uses this word to describe his work on the panopticon, that he sketched as the diagram of the disciplinary society. In the diagram you have the human and technical and bureaucratic elements that keep certain power and economic relations the way they are. The diagram is a device for the understanding of power not as something that is held or located somewhere, but rather the field of relations between actors and social bodies.
… it is the presentation of the relations between forces unique to a particular formation; it is the distribution of the power to affect and the power to be affected; it is the mixing of non-formalized pure functions and unformed pure matter… it is a transmission or distribution of particular features.
From Deleuze’s “Foucault”
Based on these two meanings, the diagram, rather than the map, is a more interesting format to engage both with the technical working of the protocols and with the understanding of the power relation you participate in.
Using internet measurement tools such as traceroute, whois, BGP routing tables and Graphviz and the DOT language to create diagrams of the economic and power relations these represent. The workshop uses data from CAIDA, http://www.caida.org/home/, which through its datasets already points at what we aim to explore during the workshop.
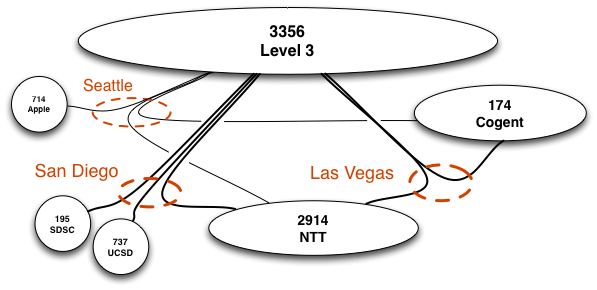
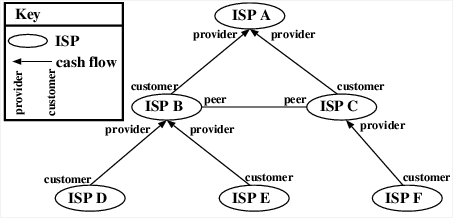
From such images as the above, which are not analogies or depictions, but the schematization of the economic-power relation between elements of the network, it becomes much clearer how ’network-agnosticism’, ‘de-centralization’, ‘anarchic routing’, do not mean the disappearance of power relations, but rather their intensification in specific ways. The node that can offer the most connectivity controls to a higher extent the flows in the network.
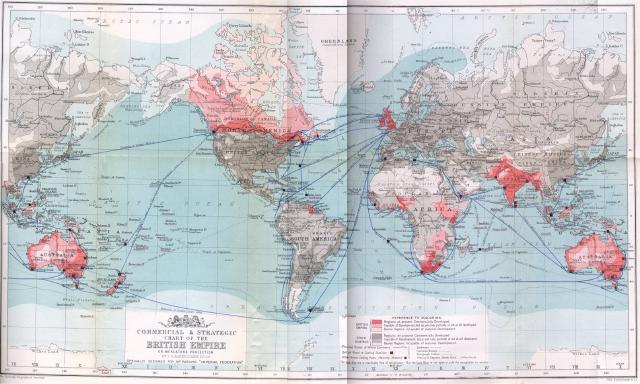
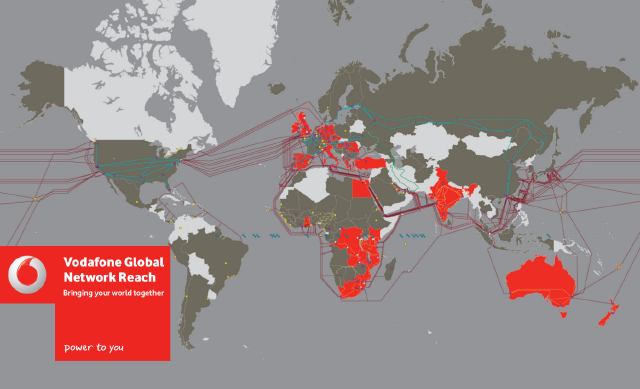
Furthermore, here is where the geography and the historical-material conditions come back in forming these hierarchies. Only some companies can afford to throw cables across the ocean, which clearly puts you towards the top of the pyramid.
Consider the two maps below that show different but related systems that are around 100 years apart.
The Tools
For this workshop, which builds on earlier work, we created a set of tools as wrappers and translators for common internet measurement tools. These can be found in here https://stuff2233.club/amro/ (mirror of the zip).
Some uses:
    ./non.py -ca servus.at

         will give out a series of AS numbers ike 24940,20965,21320,1853


     ./aslookup.py 24940,20965,21320,1853

         will give out the csv lines of the called AS numbers relations


    ./aslookup.py 24940,20965,21320,1853 | ./dotify.py

    will output a .dot file of a graph..


    ./aslookup.py 24940,20965,21320,1853 | ./dotify.py | dot -Tsvg > graph.svg

    will create a diagram of the relations called graph.svg
Staying on topic with workshop’s focus, we started a round of introductions and asking the everyone the question who they pay for their internet.
The workshop description, from https://www.radical-openness.org/en/programm/2018/maps-not-network-territory, is below:
This workshop consists of a collective walk-through to the question “where are we on the net?”, with the aim to develop a critical understanding of the “wheres” of networks.
The representation of Internet links as flattened on a geographical map, suggested by the localization of an IP address with GPS coordinates, further conceals the relation between network and territory. While the intention of reaffirming the materiality of networks is admirable, we need to develop mapping methodologies that are able to grasp how Internet infrastructure ‘works’, what power structures it reinforces, and what legacy comes with it.
To do so, we will combine an introduction to basic networking tools with an effort to think in terms of topology and situology. Topology is concerned with the relations between the points in a space rather than their position, so it will be the starting point to attempt ways of mapping network infrastructures that reflect their political economy.
-
Of course, I looked at GeoIP extensively for the project Bordercheck, and it is there that I also realized the limits of the method. ↩︎